MACD (Moving Average Convergence Divergence) is a renowned and widely used technical indicator in the world of trading and investing. Developed by Gerald Appel in the late 1970s, MACD has maintained its popularity for decades, offering valuable insights into market trends and potential trading opportunities. In this article, FWX will delve into the intricacies of MACD, from its core components to how it can be effectively utilized in financial analysis.
What is MACD?

MACD, also known as Moving Average Convergence Divergence, has been one of the most commonly used and widely available technical indicators for many years. It was developed by Gerald Appel in the late 1970s and has been popular among traders and investors ever since.
What does MACD 12, 26 and 9 mean?
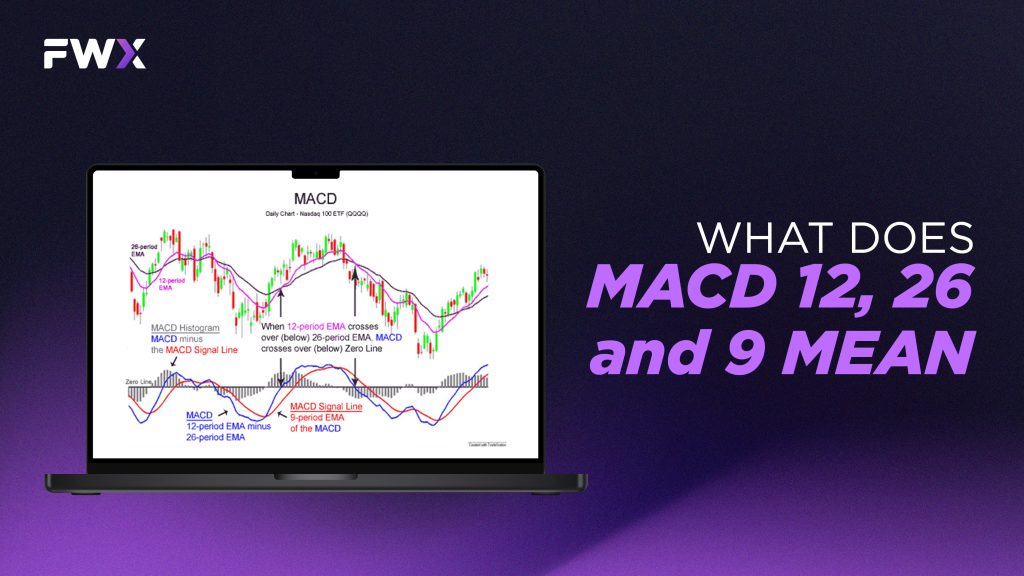
Technically speaking, the MACD 9, 12, and 26 refer to the distinct exponential moving average periods utilized in determining the MACD line and the Signal line within the MACD indicator. MACD 9, 12, and 26 refer to the specific exponential moving average (EMA) periods used in the calculation of the MACD indicator. These numbers represent the default settings in most technical analysis software and are the most commonly used periods for the MACD calculation.
The meaning of each number is partitioned into 3 components, as follows:
- MACD 12: This refers to the shorter EMA period, typically used for the closing prices of a security, commodity, or index. The 12-period EMA is more responsive to recent price fluctuations.
- MACD 26: This denotes the longer EMA period, also applied to the closing prices. The 26-period EMA offers a smoother line, reacting more slowly to price shifts.
The difference between the 12-period EMA and the 26-period EMA results in the MACD line, which represents the relationship between short-term and long-term price trends.
- MACD 9: This number represents the EMA period used to create the Signal line. The Signal line is a 9-period EMA of the MACD line, offering a more refined representation of the MACD line’s movements. The Signal line is employed to produce buy and sell signals when it crosses over or under the MACD line.
Why does MACD use 12 and 26?

The MACD uses the 12 and 26 periods because these values were found to be effective by its creator, Gerald Appel, in the 1960s. He determined that these specific periods provided reliable signals for trend-following, capturing the balance between short-term and long-term price trends. As a result, the 12-period EMA represents a faster, short-term trend, while the 26-period EMA captures a slower, long-term trend. The MACD line is then calculated by subtracting the 26-period EMA from the 12-period EMA, representing the relationship between the short-term and long-term trends.
It is essential to recognize that the default settings (12 and 26 periods) can be adjusted according to individual trader preferences or the market being analyzed. In addition, some traders experiment with alternative EMA combinations to optimize the MACD indicator for their unique trading strategies and market circumstances.
How do you read a MACD?
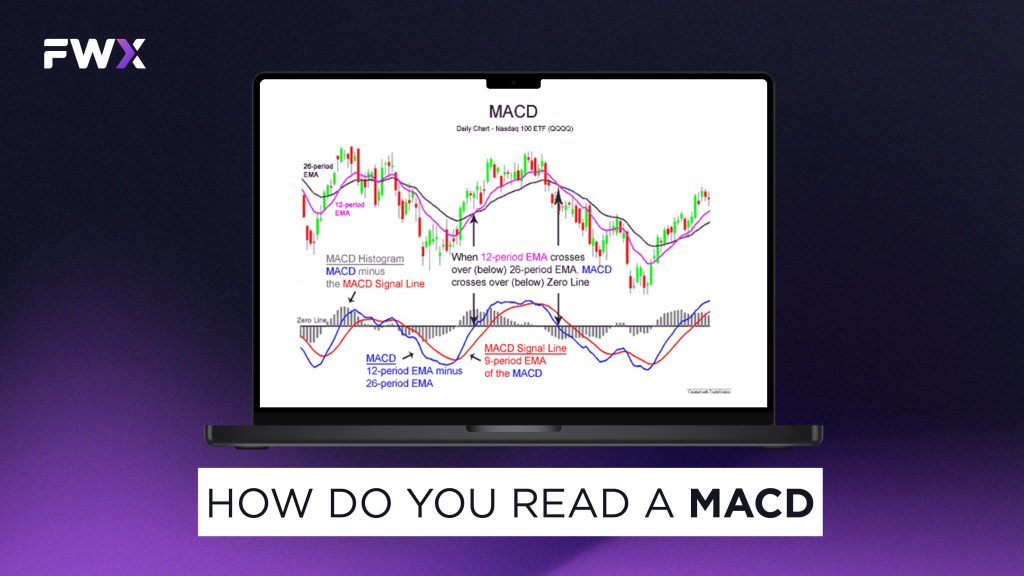
Reading a MACD involves interpreting its components and understanding the signals it provides. The MACD consists of three main parts: the MACD line, the Signal line, and the MACD Histogram. To read a MACD, you need to know first how to calculate the MACD lines and Signal line:
- MACD line: The MACD line is calculated by subtracting the 26-period exponential moving average (EMA) from the 12-period EMA. This line represents the relationship between short-term and long-term trends. For example: If the 12-period EMA is at 125 and the 26-period EMA is at 120, the MACD line would be 125 – 120 = 5.
- Signal line: The Signal line is a 9-period EMA of the MACD line. It serves as a reference point for buy and sell signals. For example: If the MACD line’s values over the last nine periods were 4, 5, 6, 5, 6, 7, 8, 6, and 5, the Signal line would be the 9-period EMA of these values.
Some key steps to use:
- Understand the three components of MACD:
- MACD line: Calculated by subtracting the 26-period EMA from the 12-period EMA.
- Signal line: A 9-period EMA of the MACD line.
- MACD histogram: Displays the difference between the MACD line and the Signal line.
- Identify MACD signals:
Crossovers:
- Buy signal: When the MACD line crosses above the Signal line, suggesting an upward trend.
- Sell signal: When the MACD line crosses below the Signal line, indicating a downward trend.
Divergences histogram:
- Positive divergence: When the price reaches a new low but the MACD line does not, suggesting waning bearish momentum and a potential trend reversal.
- Negative divergence: When the price reaches a new high but the MACD line does not, indicating diminishing bullish momentum and a potential trend reversal.
MACD histogram:
- Bullish histogram: When the MACD histogram bars rise above the zero line, it indicates a bullish trend. The height of the bars also indicates the strength of the trend. As long as the bars are rising, the trend is gaining momentum.
- Bearish histogram: When the MACD histogram bars fall below the zero line, it indicates a bearish trend. The height of the bars also indicates the strength of the trend. As long as the bars are falling, the trend is gaining momentum.
How do you use MACD effectively?
To use MACD effectively, traders should know the following:
- Traders must first identify the overall trend of the market. Since MACD is a tool that follows the trend, it works best when the market is trending.
- Traders can use MACD on different timeframes. For example, a longer-term MACD on a weekly chart can help identify the overall trend, while a shorter-term MACD on a daily chart can identify potential entry and exit points.
- MACD can be used in combination with other indicators, such as Relative Strength Index (RSI) or Bollinger Bands, to confirm signals and increase the probability of success.
- One way to use MACD effectively is to look for divergences between the indicator and price action. A bullish divergence occurs when the price makes a lower low, but the MACD makes a higher low, indicating that momentum is shifting to the upside. A bearish divergence occurs when the price makes a higher high, but the MACD makes a lower high, indicating that momentum is shifting to the downside.
- The MACD histogram is a visual representation of the difference between the MACD line and the signal line, plotted as bars on a chart. It is a valuable tool for identifying trends, with a rising histogram bar above the zero line indicating a bullish trend. In contrast, a falling histogram bar below the zero line indicates a bearish trend.
- Traders must always have a risk management plan in place when using MACD or any other trading strategy. This includes having straightforward entry and exit strategies and stop-loss orders to limit potential losses.
Moving Average Convergence Divergence in summary

- MACD is a momentum indicator that follows trends.
- MACD is often regarded as one of the most effective tools for identifying trends.
- MACD is composed of three exponential moving averages.
- Exponential moving averages assign more importance to recent data and less to older data.
- The most frequently used exponential moving averages for MACD calculation are 9, 12, and 26 periods, which are the default settings in most technical analysis software.
- Short-term moving averages react more quickly to price changes, while long-term averages respond more slowly.
- The MACD indicator has two lines: the MACD line and the Signal line.
- The MACD line is the difference between a 12-period and a 26-period EMA of prices, plotted as a solid line.
- The Signal line is a 9-period EMA of the MACD line.
- Moving averages other than the standard 9, 12, and 26 can be used, as some traders attempt to optimize MACD by employing alternative EMA combinations.
- Most traders do not perform these calculations manually; computers provide faster and more accurate results. It is recommended that readers utilize technical analysis software for this task if not already in use.
- MACD interpretation typically involves three widely used methods:
- Buy and sell signals occur when the MACD line crosses above or below the slower Signal line.
- Divergence: When prices deviate from the MACD, it often indicates a trend’s end.
- A steep rise or fall in the MACD Line suggests that when the difference between the MACD and signal lines reaches an extreme and reverses, prices are considered overbought or oversold.
- The MACD-Histogram visually represents the difference between the MACD and Signal lines, illustrating the spread between the two.
- The MACD histogram’s slope and directional changes can help identify turning points.
- MACD analysis can be applied to any security, commodity, or index.
- Similarly, it can be used across various time frames, from very short (minutes) to very long (monthly).
- Both short-term traders and long-term investors will find this indicator valuable.
- The best signals occur when short-term analysis aligns with longer-term analysis, putting the trader in sync with the major long-term trend.
- Before trading signals generated by MACD, it is recommended that readers closely examine price charts alongside corresponding MACD studies to observe firsthand how the studies relate to price movements.
- While no claims are made about MACD’s statistical validity, it is empirically observed to be effective, like many other useful technical analysis techniques.
Conclusion
In conclusion, MACD is a versatile and powerful tool that traders and investors can use to gain an edge in the dynamic world of financial markets. Its ability to capture both short-term and long-term trends, identify crossovers and divergences, and provide valuable buy and sell signals makes it an invaluable asset in technical analysis. However, as with any trading tool, it’s crucial to use MACD in conjunction with other indicators and exercise prudent risk management. By mastering the art of reading and applying MACD effectively, individuals can enhance their decision-making processes and navigate the complexities of the financial markets with greater confidence.